Visualize bird songs with spectrograms
Author
Jeff Mann
Date Published

Recording bird songs is a great way to begin learning how to identify birds by ear. But listening to your clips isn’t the only way to enjoy and study them. Spectrograms add a whole new layer to your bird recordings, enabling you to study them visually and see how species vocalize in different ways.
What is a spectrogram?
A spectrogram is a visualization of an audio recording based on the frequency of sound over time. This differs from a traditional waveform that visualizes a sound based on its amplitude.
Here is a spectrogram and waveform of a Carolina Chickadee to illustrate the difference between the two. Which of these gives you more helpful information?
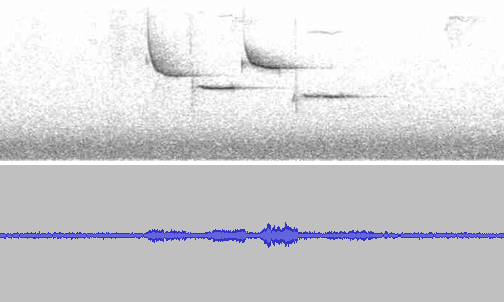
The spectrogram above helps your eye visualize what the song "looks like". The higher the line is, the higher the note.
Spectrograms are immensely useful in adding new data points for your mind to leverage when trying to identify a bird in the field.
When you are out birding, learning field marks (obvious visual cues) combined with what a bird sounds like and what the spectrogram looks like in your mind will help you identify birds.
A new way to study
I study my spectrograms while listening to the bird songs to help create a holistic profile of the bird in my mind to better identify it the next time I hear or see it.
How to create a spectrogram
Spectrograms can be created in several ways. I use the free program Audacity to edit my bird recordings and use its spectrogram feature to get an initial visualization of the clip as I work. After opening your audio file in Audacity, click the dropdown arrow next to the track name and select "Spectrogram."
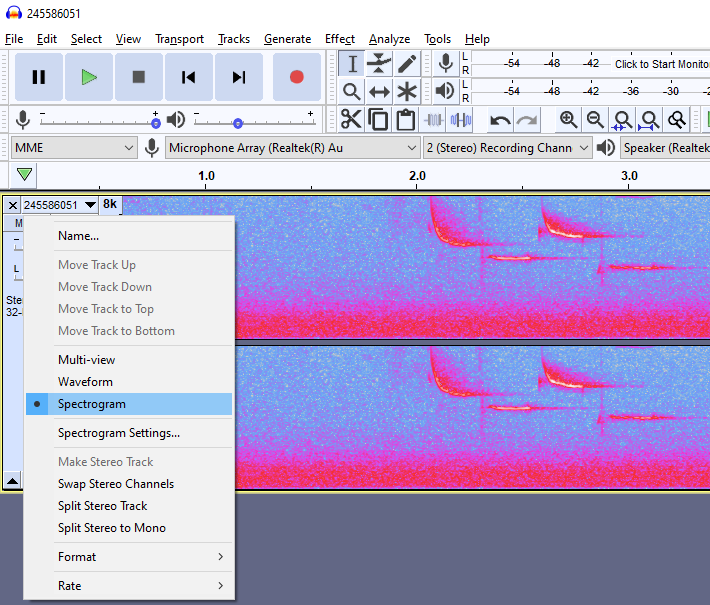
Click the dropdown, then select "Spectrogram"
Once uploaded to eBird, the website automatically will generate a spectrogram that plays along with the recording once it’s processed. Here is the final recording from eBird of a the Carolina Chickadee I saw.
Spectrograms may contain surprises
It’s always a treat to see a spectrogram of a new bird. Sometimes they will surprise you with their complexity. Check out this spectrogram of a Laughing Gull I captured in Corpus Christi, TX.
Have fun creating spectrograms of your very own!
Comments from the community
Leave a comment
No comments yet. Be the first to share your thoughts!