Project: Track backyard birds on a digital counter
Author
Jeff Mann
Date Published

I've been going deep down the BirdNET-Pi rabbit hole over the last month. A BirdNET-Pi setup uses a Raspberry Pi computer and microphone to listen, ID, and log birds it hears 24/7.
On the BirdNET-Pi interface, you get lots of great daily and historical detection data, including the number of detections in the last 24 hours.
I came up with an idea to automatically show this count on some kind of digital counter. With this project idea in mind, I did research to find suitable parts to build and program it.
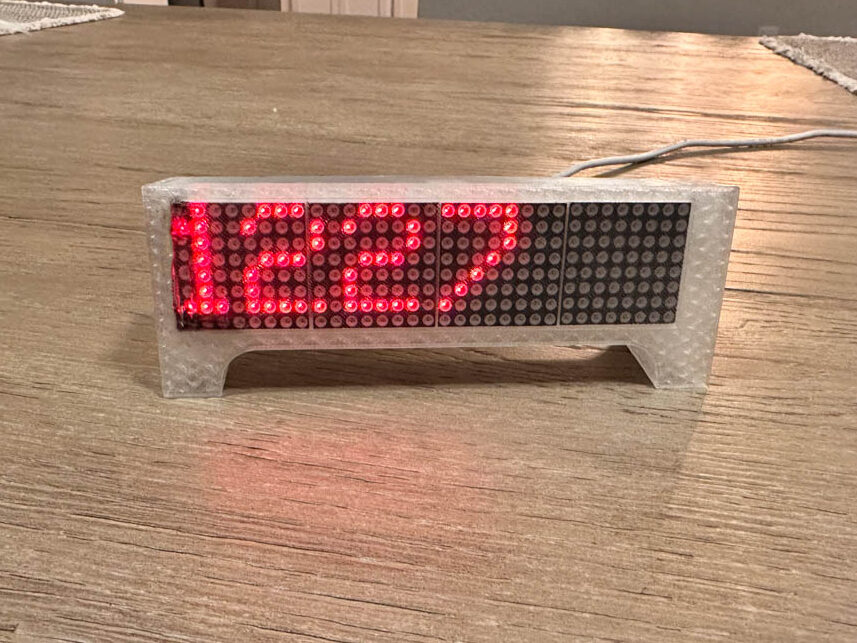
The completed digital bird counter. It displays the number of times birds have vocalized on the current day and the latest species.
Contents
- Components
- Prerequisites
- Getting started
- Flashing the microcontroller
- Configuring wledPixel
- Configuring a NodeRed flow to transmit the detection count
- Optional: Display the latest species detected
- Optional: Get the count for the current day only
Components
Component | |
|---|---|
Dot Matrix Display | |
ESP-8266 computer | |
Case | |
USB C cable | |
Power Supply |
These are links to components on Amazon that will work for this project
A heads up: this is a complicated project that requires several systems to be set up and working already.
Prerequisites
Requirement | My recommendation |
|---|---|
A running BirdNET-Pi installation | |
Your station sending data to BirdWeather | |
NodeRed Client | |
MQTT Server |
Getting started
BirdNet-Pi and BirdWeather
My BirdNET-Pi installation has been running since December 2022 and has picked up all kinds of great detections and recordings (30,000+). The station logs all of the data locally, but you can optionally submit your detections to a service called BirdWeather. BirdWeather's API makes this whole project possible as it lets you request the data needed for the display.
Flash the microcontroller
The brains of the sign is the Wemos D1 Mini. This small ESP8266 board will be flashed with a program called wledPixel which will receive and display the messages. The process is a bit involved, so rather than re-explain it here, there are a few guides you can follow.
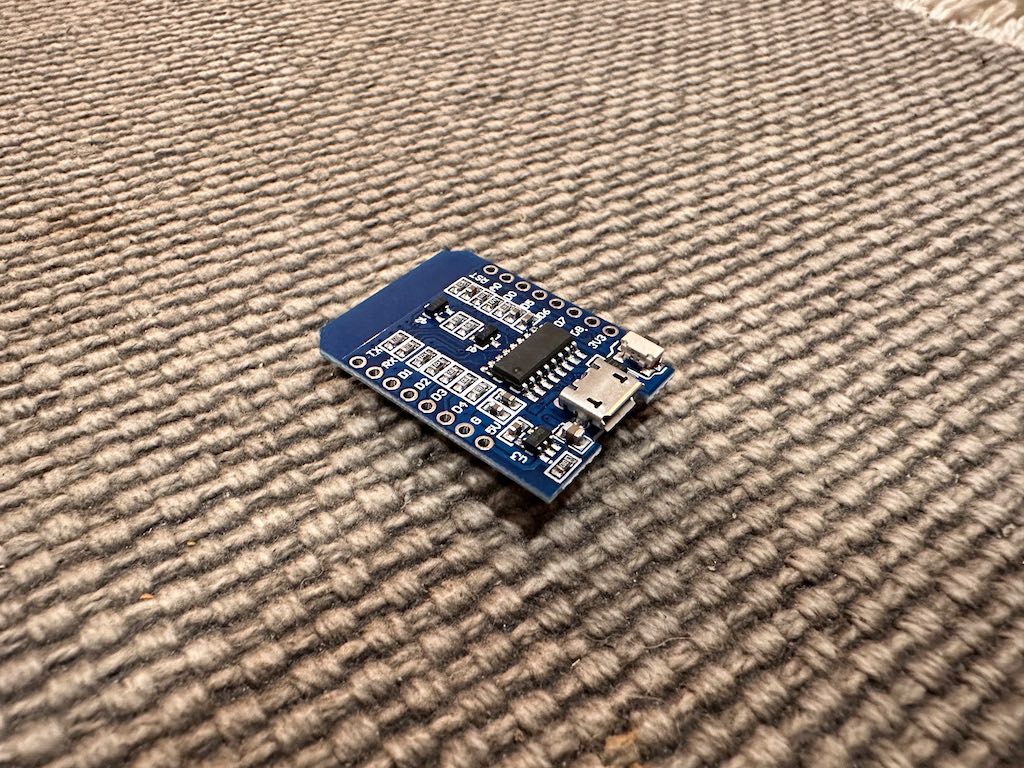
The Wemos D1 Mini microcontroller
I used two guides to flash the D1 Mini chip. To flash the chip you'll need to install ESPTool on your computer. I have a Mac and used this guide. Use ESPTool to flash the device using a few terminal commands from this guide. However, don't follow it to the end and install Tasmota. (what that guide is talking about). Instead, download the wledPixel.bin file and put it in the same folder you installed ESPTool in.
Flash the chip using the commands in the second guide but replace the name of the .bin file in the commands with the wledPixel.bin name. In my case, I renamed the .bin file to wledPixel.bin to make it easier.
Once the flash is successful, unplug and replug the D1 Mini and let it boot. Connect to the Wi-fi network it is broadcasting and enter your network details to get it connected to your network. wledPixel is now ready to be configured, but first, we'll need to wire the display to the board.
Wire the display to the board
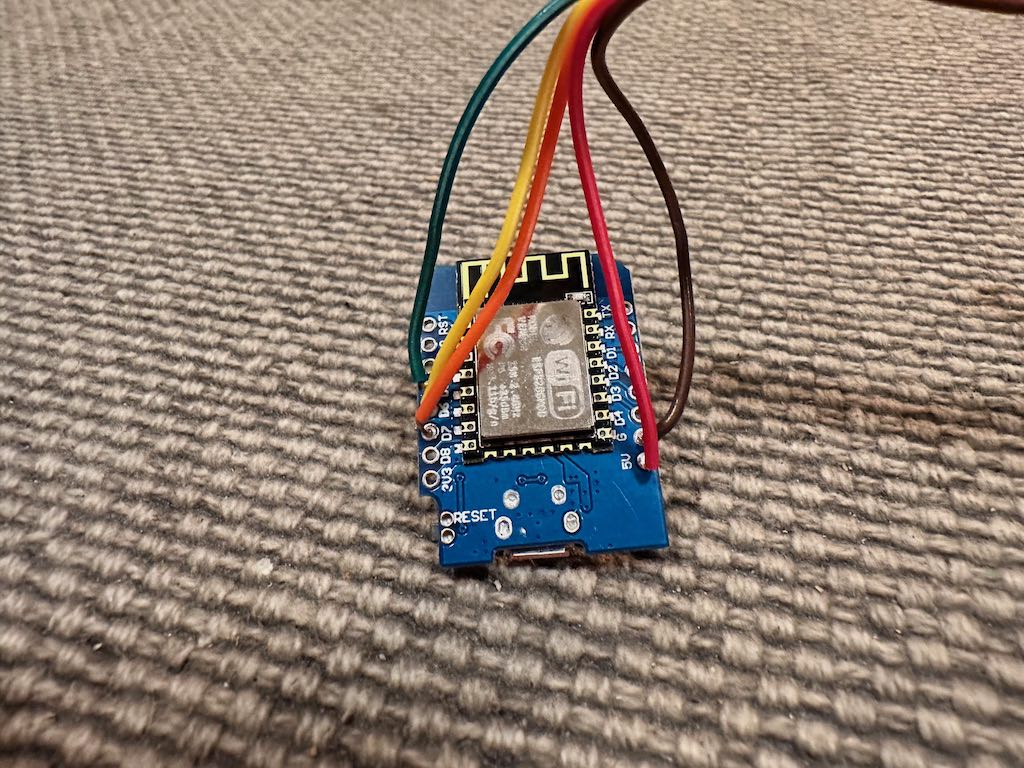
The Wemos D1 Mini with the wires soldered to the correct connection points.
The wledPixel GitHub page has a wiring diagram for the display and board. I don't know how to read these confidently, so I followed along with this build video on YouTube to connect and solder the wires correctly.
Power it up (with 5V)
It's crucial that when you connect this to an outlet for power, you use a 5V power block. Anything more will fry the D1 Mini you worked so hard on.
When you boot it up with the display connected, hopefully, it lights up and displays the device's IP address. Navigate to this IP address in your browser and you'll see the interface and can configure the settings.
Configure wledPixel
Feel free to play around with the settings in the configuration to get it to your liking.
Display settings
Navigate to wledPixel's settings page and set the options as follows:
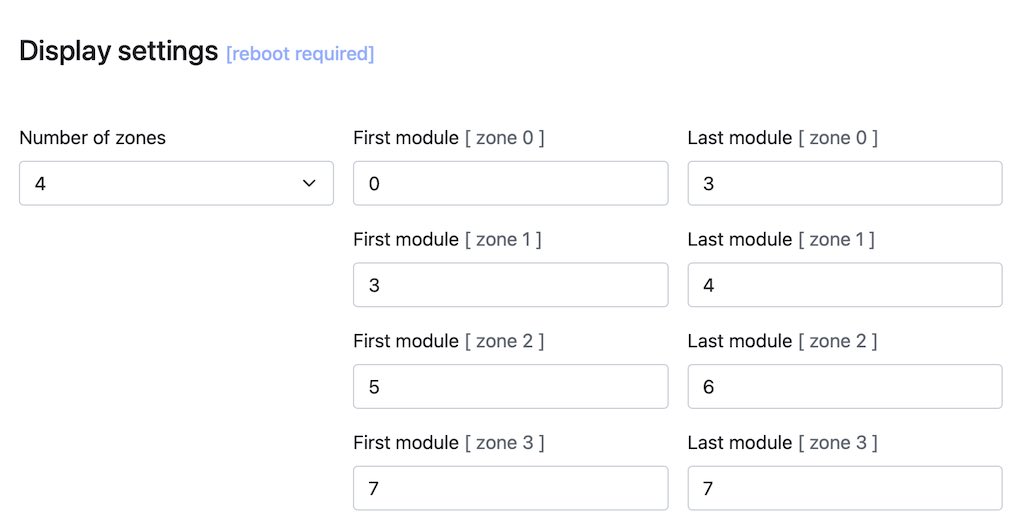
Zone0 Settings
Set Zone0's options as follows:
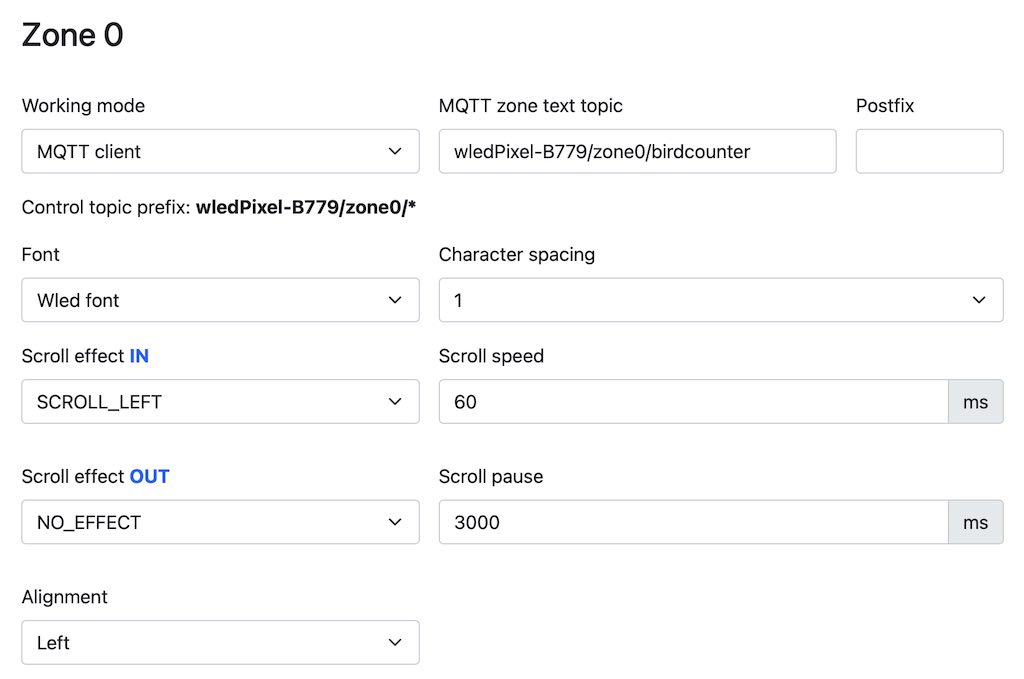
You can adjust these settings as desired to change how the sign displays the messages.
MQTT Settings
Add in the info for your MQTT server.
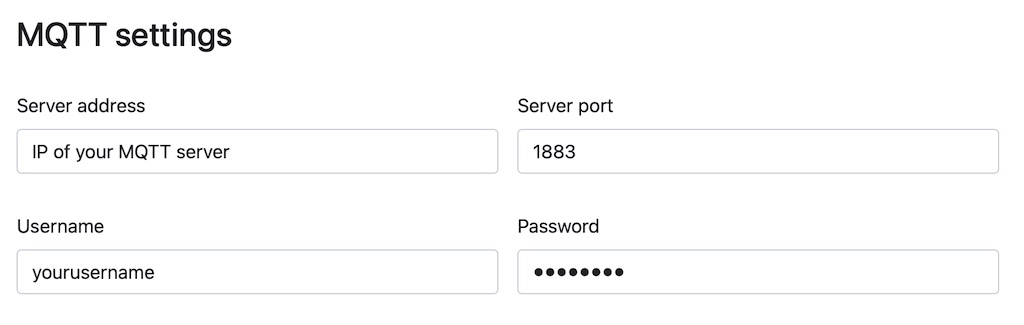
Enter your MQTT server info and save the settings.
This finishes the configuration of wledPixel.
Creating a NodeRed flow to transmit bird detections to the sign
The sign is now ready to receive the bird count. To send the count to the sign we will use NodeRed.
A NodeRed Client and MQTT server are required for this project. Since I already had a Home Assistant server in my home, I used that for the NodeRed and MQTT Server capabilities. You can use a Raspberry Pi or Libre Computer and install MQTT and NodeRed on it without having to use HomeAssistant.
A NodeRed "Flow" will be used to request the detection data, parse the response, and transmit the count in a message via the MQTT topic "birdcounter" to the digital sign.
Create a new NodeRed Flow
On the Flows page in NodeRed there may be a default "Flow 1" already there for you to begin working on. If not create a workflow and name it something like "Bird Counter".
Add a node to request BirdWeather data
On the left side of the page are all the available nodes you can add to your flow. Search for "http", drag an "http request" node onto your canvas, and double-click it to open up the configuration.
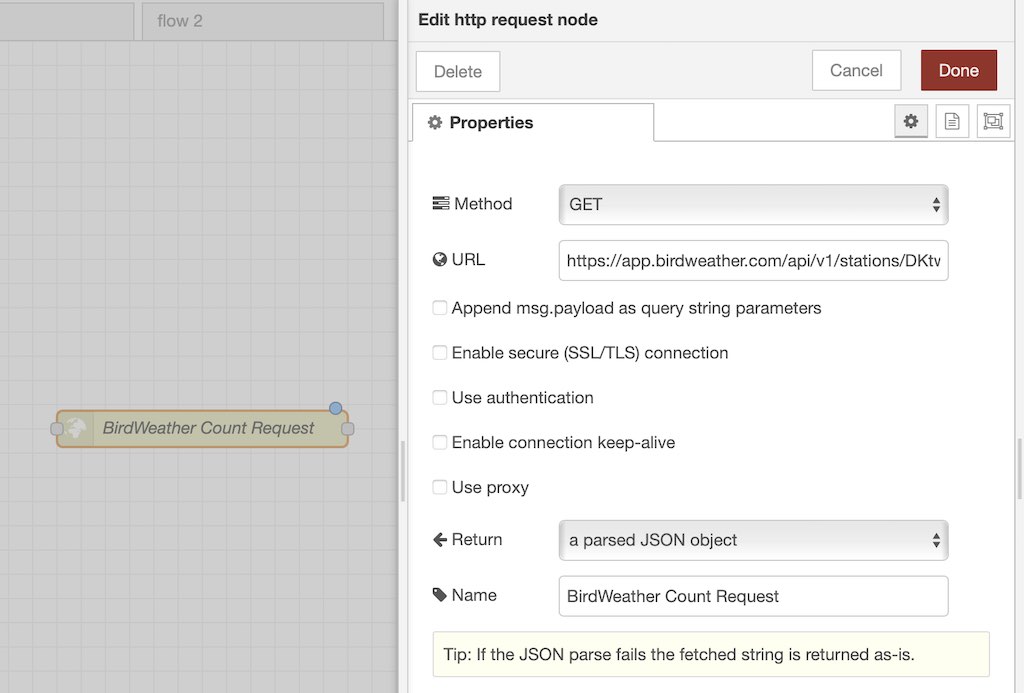
BirdWeather offers an API to request a station's detection data. We'll use this API to get the day's data for our station.
In the configuration panel, add the following URL to the URL field, replacing [token] with the token/station ID you are provided when you get set up on BirdWeather.
https://app.birdweather.com/api/v1/stations/[token]/stats
For the "Return" option, select "a parsed JSON object", give the node a name in the final field, then click done.
Add a node to include the detection count in your message
On the left side, search for "Change" and drag this node on your canvas next to the first node.
If you click the anchor points on the nodes and drag to another node, you'll connect the two and it will pass along its payload (message). Once you've connected them, double-click the change node to open the configuration panel.
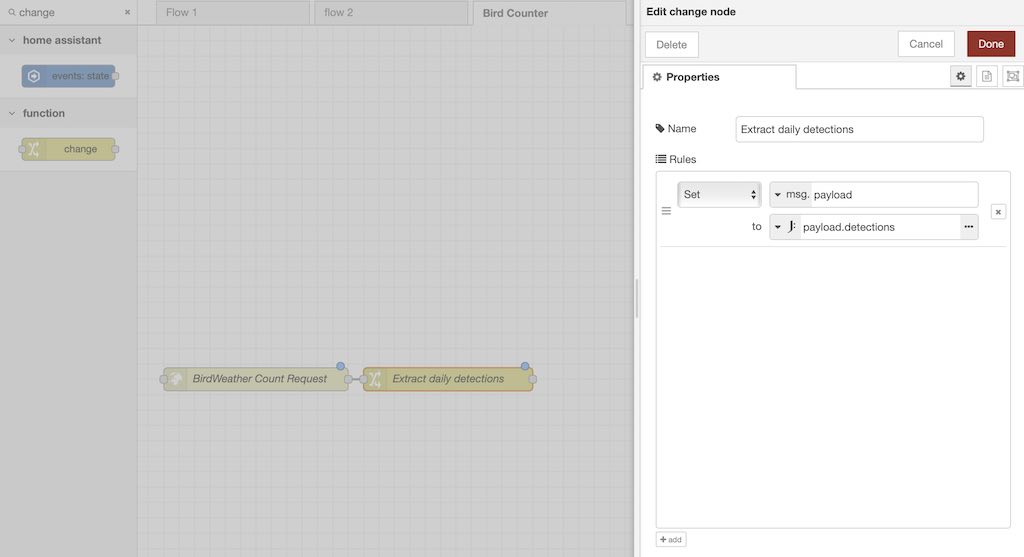
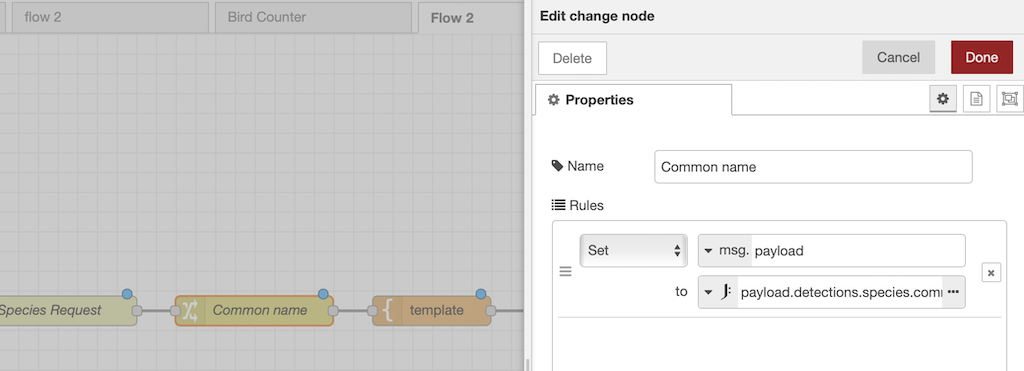
Set msg.payload to payload.detections and change the icon on the second line to Expression using the small dropdown button
Give it a useful name and set the rules as follows. Click the icon on the second line and change it from .msg to "expression" then set the rule:
Set msg.payload to payload.detections
This adds the number of detections to the message about to be sent to the counter.
Add a node to send the final message to the counter
Now, we need a node that will transmit our final message payload to the counter which is listening on the MQTT topic of "wledPixel-B779/zone0/birdcounter". The first segment "wledPixel-B779" will be replaced with the name of your display (see below).
On the left, search for "MQTT" and add in an "mqtt out" node and connect it to the previous node.
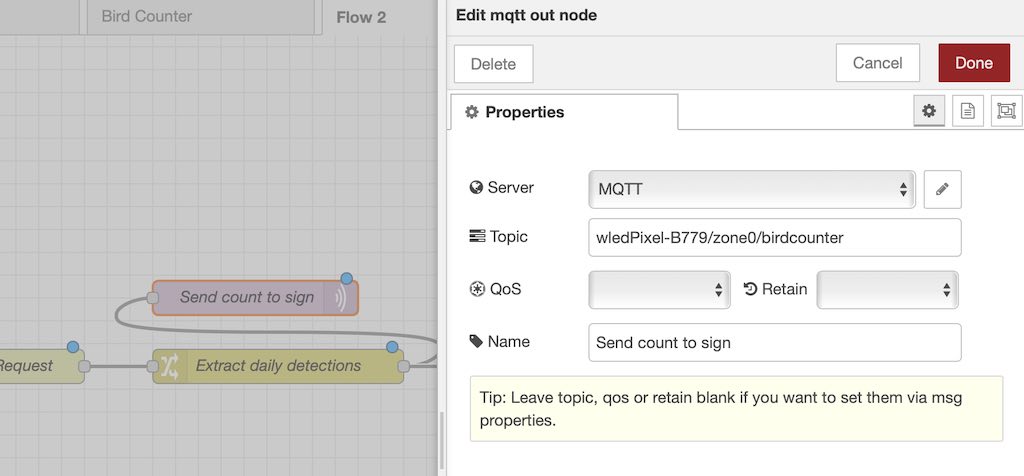
Add the topic "wledPixel-B779/zone0/birdcounter" and give it a descriptive name. The first segment of the topic will be the name of your display
On the configuration panel, add the topic "wledPixel-B779/zone0/birdcounter" and a descriptive name then click "Done"
Make it loop
Next, we want to make the whole thing loop to update the number, but not constantly. Following similar steps, add a Delay node and connect it to the Extract daily detections node and, using the other side, connect it back to the first node as shown below. Using its configuration panel, set the delay to 60 seconds, leaving the other options default. This will loop the whole flow every minute.
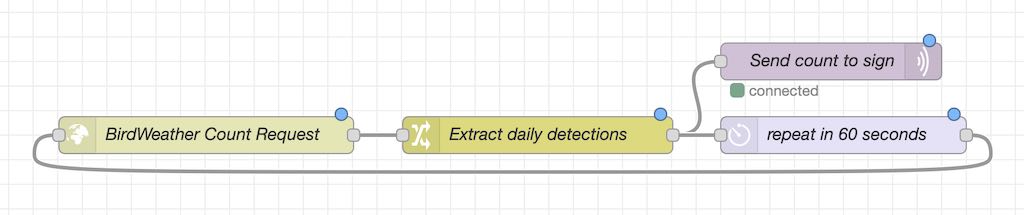
Create a delayed loop back to the beginning to update the count
Add a button node to start the whole thing
Add an "Inject" node to the workflow on the left side and connect it to the first node we made. When the button on this node is clicked it will start the process and it will keep running indefinitely thanks to our loop.
Our final NodeRed flow. It sends the current detection count to the bird counter every 60 seconds.
Click deploy and click push the virtual button
Click the red Deploy button to save and publish your new NodeRed workflow. Now is the moment of truth. If your digital sign/D1 Mini is plugged in and online listening to the "wledPixel-B779/zone0/birdcounter" topic, as soon as you click the button in your NodeRed workflow the current bird count will light up on the screen!
Optional: Display the latest species
Now, if you want to get fancy, you can display the latest species following the current bird detection count. Let's see how to do that.
Request the latest species from BirdWeather
Remove the final loop back from above and add a new http request node.
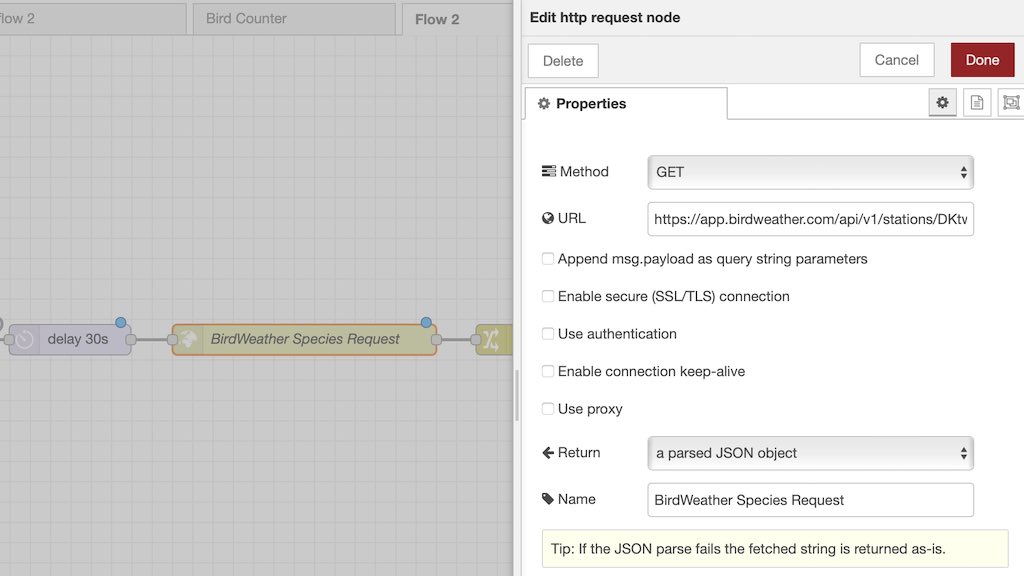
A new http request node will get the latest detection data
Use another http request node and use the following URL:
https://app.birdweather.com/api/v1/stations/[token]/detections/?limit=1
Extract the species name from the returned data
The above API request will return all kinds of data about the most recent detection, including the common name of the bird. We'll extract the common name from the data with the Change node.
Set msg.payload to expression: payload.detections.species.commonName as in this screenshot
Add another Change node and add the following rule:
Set msg.payload to expression: payload.detections.species.commonName
Create a template message to send to the sign
Instead of just pushing only the name to our sign, we'll format the message as follows:
Latest bird : [Bird Name]
To accomplish this, we'll use the Template node. Add this node to your flow and add this template:
Latest bird : {{payload}}
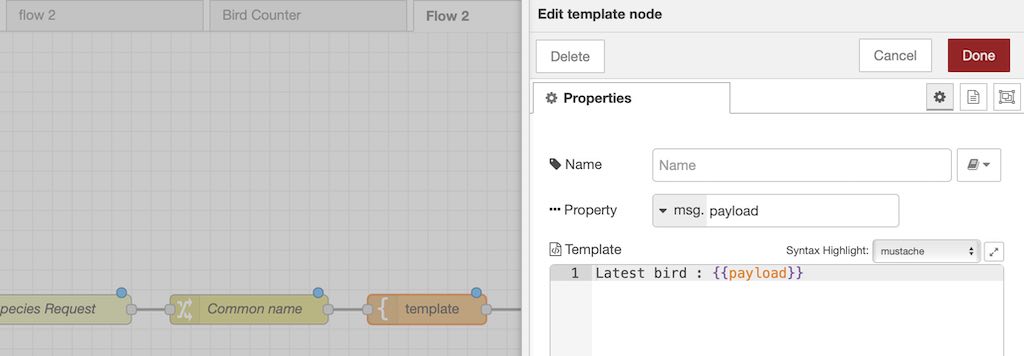
This template will format the final message
This updates the message and it's ready to be sent to the sign.
Send the message
Similar to the detection count, we'll use the mqtt out node to send the final message.
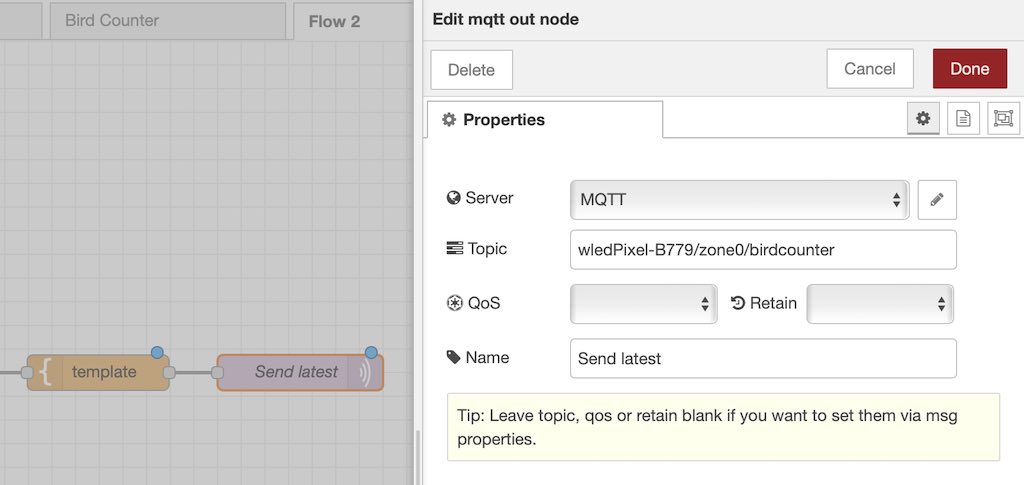
Send the final message!
Connect the new loop
Similar to the above, create a new loop back to the beginning with a Delay node in the middle.
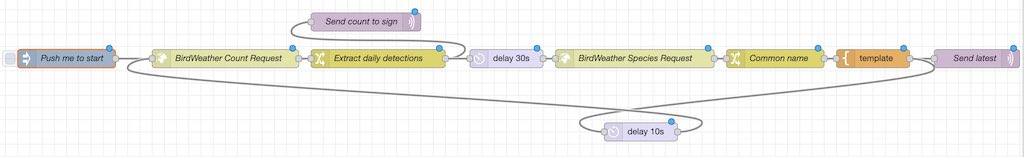
The final flow
The final NodeRed flow. This sends both the detection count and the latest species name to the sign.
3D-printed enclosure
Using the STL file linked above, you may print a 3D enclosure for the display, which will give it a nice finished look.
Optional: Get count for current day only
The above BirdWeather API for the count gets a rolling 24-hour period of counts, so it never really goes down to zero. I wanted to have the count for the current day only so it was more fun to watch, the current dev for the project was kind enough to provide custom code to make this possible.
To accomplish this, we need to do three things. Add a custom PHP file to our BirdNet-Pi station and edit the API Request node for the count data, and edit the Change node.
Edit Count Request node
We'll start with the node first. Edit the first node we created "BirdWeather Count Request", then use the following URL and click save.
https://[address to your BirdNET-Pi]/today_count.php
Edit Change node
Edit the change now and use the following template:
Set msg.payload to payload.today_count
Add custom file to BirdPi-NET install
SSH into your BirdNET-Pi and run the following command. This command will download the needed file and place it in the proper location.
wget https://gist.githubusercontent.com/ehpersonal38/a34ce000e1645bc85aba936a5f89ac72/raw/43311739c3176f1b77e298ae5fabd58afc27250b/today_count.php -O ~/BirdNET-Pi/scripts/today_count.php
Now when the NodeRed flow is updated, deployed, and initiated, the flow will call on your station for the data for the current count and it will be for the current day only.
Comments from the community
Leave a comment
Diego Lizcano
May 8, 2023
Thanks, Jeffrey. Great Post! Since my BirdNetPi https://app.birdweather.com/stations/754 is installed in the backyard of my mother-in-law and not in my local network your tutorial made my day. Now I have the name of the last detected species in my MagicMirror. Just in case this is the link to the flow https://flows.nodered.org/flow/cf0ca8b89bdc36d7cdbb5d5a04441c5e Diego
Jeff MannAuthor
May 8, 2023
Appreciate it, Diego! Thank you for sharing! It's awesome to see new ways to integrate the data from the API! 🎉
Joseph
Feb 23, 2023
Jeffery great project! I have mine set up, it is sending data to Telelgram, I went ahead and built the LED matrix but am having issues getting it to display any data. it shows the ip and then just MQTT. I am going to assume the problem is with the http node in the NR flow, hope you can help. You say - In the configuration panel, add the following URL to the URL field, replacing [token] with the token/station ID you are provided when you get set up on BirdWeather. Mine says this- https://app.birdweather.com/api/v1/stations/inserted the api from tim here/stats but again no data is flowing to the sign? am I missing something?
Jeffrey Mann
Feb 23, 2023
Hi Joseph, I would do a test message to the sign via the NR flow via MQTT just to prove the sign can receive messages correctly. You can simply inject the default message of a timestamp with the Inject node and send that to the sign. Once you've verified the sign can receive and display a test message, I would work on debugging your API URL by putting it in the browser and see if the JSON is displayed on the page. I personally used a tool called Postman to try out different API calls and see the results. Let me know if you can't figure it out! I'm happy to help!
Joseph
Feb 23, 2023
Thanks. I "think" I have got it figured out, it was the bin file, I submitted a issue and then reflashed with the new file and it sems to be working now. Issue I am trying to work through now is getting it to display the correct info, I wrote the NR flow as you said all the way down to but not including the- Optional: Get count for current day only. but all I am getting is a total count, need to go back and double check my info, I have learned that 99.9% of the time it is a forgotten or mis-typed entry!
Jeffrey Mann
Feb 23, 2023
Best of luck! For the count, if you are using the BirdWeather API /stats call, it will show a rolling count of the last 24 hours as the default, so the number will usually never go down close to zero if you are having regular detections. That's why I looked into a daily count only using the Pi itself. It was more fun to see it start from zero.
andre ploeger
Feb 19, 2023
Thanks for the tutorial,got the display running,but i struggle with the API. i just see a page not found at https://app.birdweather.com/api/v1/ Andre
Jeffrey Mann
Feb 19, 2023
I'm glad you're enjoying the tutorial! Weird! When I visited that link just now I see the page with the API documentation for BirdWeather. Is there something on your network blocking you from accessing it?
andre ploeger
Feb 21, 2023
thanks for the bump,i figured the problem. the Count over API is working and Bird names showing. The local count makes Problems now,i not get a return when i use http://ploegy.duckdns.org/today_count.php
Jeffrey Mann
Feb 21, 2023
Yay! Did you create the local count file with the command provided in the thread? When I tried to create the file manually, my text editor caused problems with the final file.
This command worked for me, but I went in after and changed the line of code at the end for it to return JSON instead of just the count.
wget https://gist.githubusercontent.com/ehpersonal38/a34ce000e1645bc85aba936a5f89ac72/raw/43311739c3176f1b77e298ae5fabd58afc27250b/today_count.php -O ~/BirdNET-Pi/scripts/today_count.php
You can see more here: https://github.com/mcguirepr89/BirdNET-Pi/discussions/310
Example of my file returning a JSON daily count: https://birdnet.becausebirds.com/today_count.php
One more thing, I'm not sure how stable your setup is, but one thing I've noticed when making API calls locally to get the daily count, is sometimes the pi is too slow to respond and times out. I've noticed this with API calls and sometimes when accessing the GUI. I'm not sure if it's because I'm using a Pi 3B+. When it does time out, the sign typically just pushes the next latest species again until it gets around to pulling an updated count.